- 2018-06-25 21:01:24
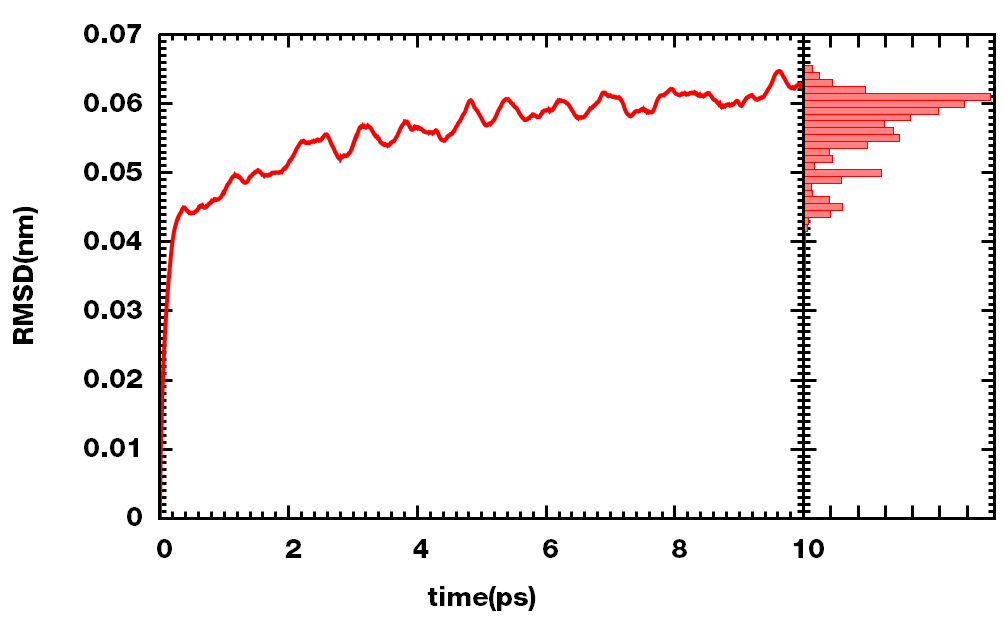
在进行蛋白的分子动力学模拟时, 经常需要查看RMSD, 看蛋白是否已经稳定. 计算RMSD的方法很简单, 直接gmx rms即可得到rmsd.xvg, 然后就可以进行作图. 在展示RMSD演化图时, 经常还会同时给出其统计直方图, 这样可以更直观地看出RMSD是否已经稳定. 下面记录使用gnuplot作统计直方图的几种方法备用.
统计分布
| gnuplot | |
|---|---|
1 2 3 4 5 | w=.001
set table
set output 'freq.dat'
plot 'C:\Users\Jicun\Desktop\_JOB\1y57\rmsd.xvg' u (bin($2,w)):(1) s f w p
unset table
|
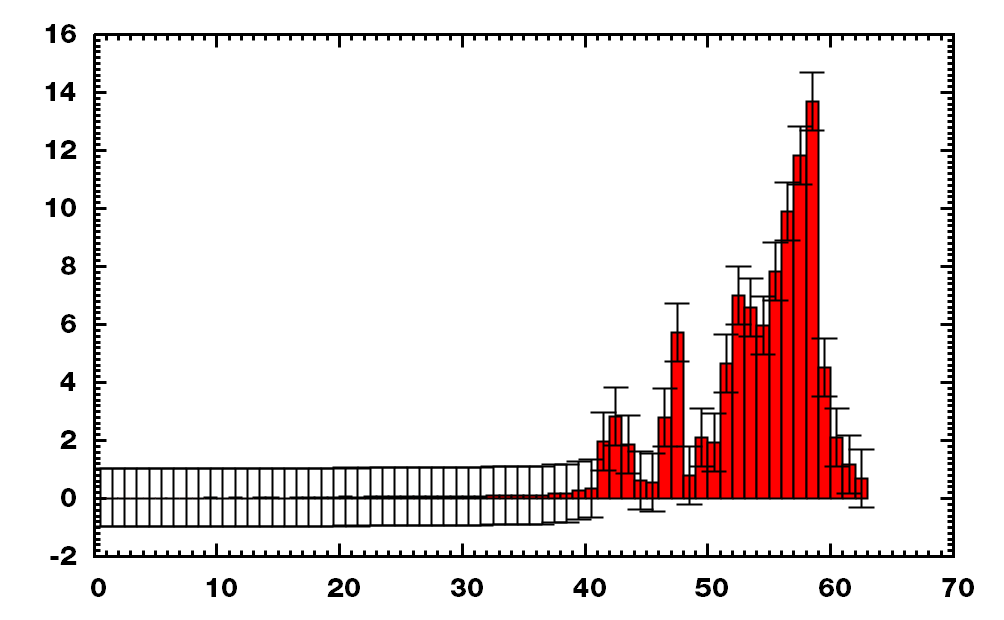
带误差的直方图
| gnuplot | |
|---|---|
1 2 3 4 5 6 7 8 | set boxwidth 1 relative
set style data histograms
set style histogram errorbars gap 0 lw 2
set style fill solid 1 border 0
set bar 2
stat 'freq.dat' u 2 nooutput
plot [0:] 'freq.dat' using ($2*100/STATS_sum):(1):xticlabels($1*1E3) lw 2 t""
|
还有另一种简单点的作法, 使用下面的boxxyerrorbars方法.
数据及其分布
可采用两种方式
| gnuplot | |
|---|---|
1 2 3 4 5 6 7 8 9 | w=.001
set x2tics 1
set xtics nomirror
set xl"time(ps)"; set yl"RMSD(nm)"; set x2label 'Freq%'
stat 'freq.dat' u 2 nooutput
plot [][0:] 'freq.dat' u ($2*100/STATS_sum):1:(0):($2*100/STATS_sum):($1-.5*w):($1+.5*w) w boxxyerrorbars axes x2y1 lc 2 t'', \
'C:\Users\Jicun\Desktop\_JOB\1y57\rmsd.xvg' using 1:2 w l lw 4 lc 1 t''
|
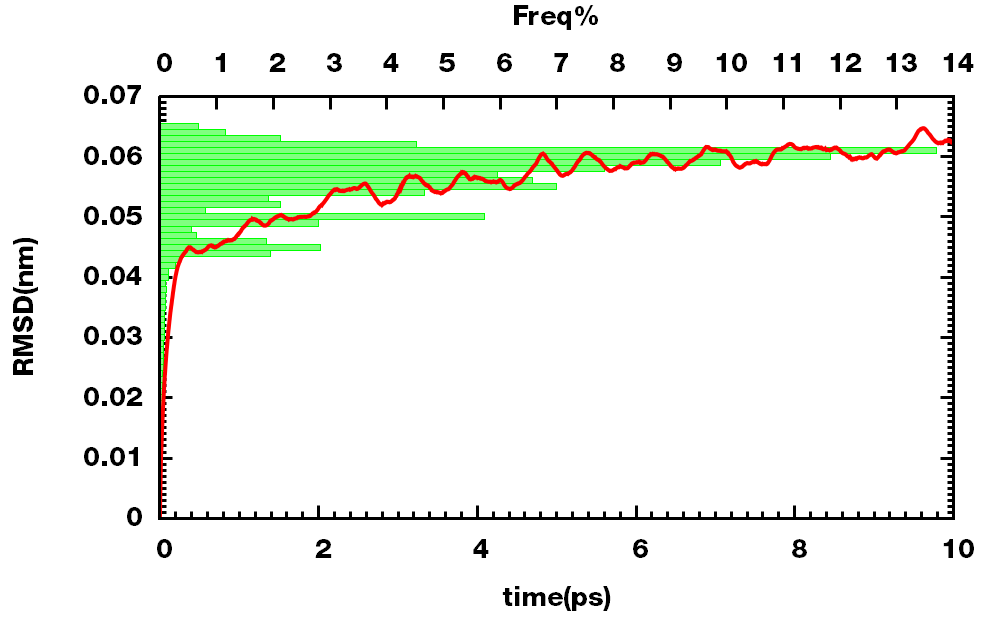
| gnuplot | |
|---|---|
1 2 3 4 5 6 7 8 9 10 11 12 13 14 15 16 | w=.001
set multi lay 1,1
set rmargin at screen 0.8
set xl"time(ps)"; set yl"RMSD(nm)"
plot [0:][0:] 'C:\Users\Jicun\Desktop\_JOB\1y57\rmsd.xvg' using 1:2 w l lw 4
set lmargin at screen 0.8
set rmargin at screen .99
unset xtics; unset ytics
set mxtics 1
set xtics format " "
set ytics format " "
set xl" "; set yl" "
stat 'freq.dat' u 2 nooutput
plot [][0:] 'freq.dat' u ($2*100/STATS_sum):1:(0):($2*100/STATS_sum):($1-.5*w):($1+.5*w) w boxxyerrorbars t''
|